

Con doce de los quince Estados de la CARICOM, Colombia suscribió el 24 de julio de 1994, el Acuerdo de Alcance Parcial No. 31 sobre Comercio y Cooperación Económica y Técnica (AAP No 31), que entró en vigor el 1° de enero de 1995. También se suscribió en mayo 21 de 1998 un Primer Protocolo que modifica las normas de origen e incluye por primera vez productos con preferencias arancelarias a favor de Colombia.
De los Estados que son responsabilidad de esta misión, hacen parte del acuerdo Trinidad y Tobago, Barbados, Granada, Guyana y San Vicente y las Granadinas. Después de 25 años de suscripción, Colombia y CARICOM están adelantando negociaciones para actualizar el instrumento internacional. También se ha expresado el interés de Colombia en que Surinam sea parte del convenio. Esta negociación es liderada en Colombia por el Ministerio de Comercio, Industria y Turismo con el acompañamiento del Ministerio de Relaciones de Colombia y la Embajada en Trinidad y Tobago.
Para más información consultar: http://www.tlc.gov.co/acuerdos/vigente/acuerdo-de-alcance-parcial-sobre-comercio-y-cooper
Cámaras de comercio regionales
Cámara de Comercio Multilateral Colombo Antillana de Integración y Turismo - CCMCAIT
Cámara de Comercio Colombo Centroamericana y del Caribe - CCCCC
BILATERAL ECONOMIC RELATIONS
With twelve out of the fifteen CARICOM States, Colombia signed on July 24, 1994, Partial Scope Agreement No. 31 on Trade and Economic and Technical Cooperation (AAP No. 31), which entered into force on January 1, 1995. A First Protocol was also signed on May 21, 1998, which modifies the rules of origin and includes for the first time products with tariff preferences in favor of Colombia.
Of the States that are responsible for this mission, Trinidad and Tobago, Barbados, Grenada, Guyana and Saint Vincent and the Grenadines are part of the agreement. After 25 years of subscription, Colombia and CARICOM are advancing negotiations to update the international instrument. Colombia's interest in having Suriname be part of the agreement has also been expressed. This negotiation is led in Colombia by the Ministry of Commerce, Industry and Tourism with the accompaniment of the Ministry of Relations of Colombia and the Embassy in Trinidad and Tobago.
Regional Chambers of Commerce
Colombo Antillana Multilateral Chamber of Commerce for Integration and Tourism - CCMCAIT
Colombo Central American and Caribbean Chamber of Commerce - CCCCC
Trinidad Y Tobago
Balanza Comercial
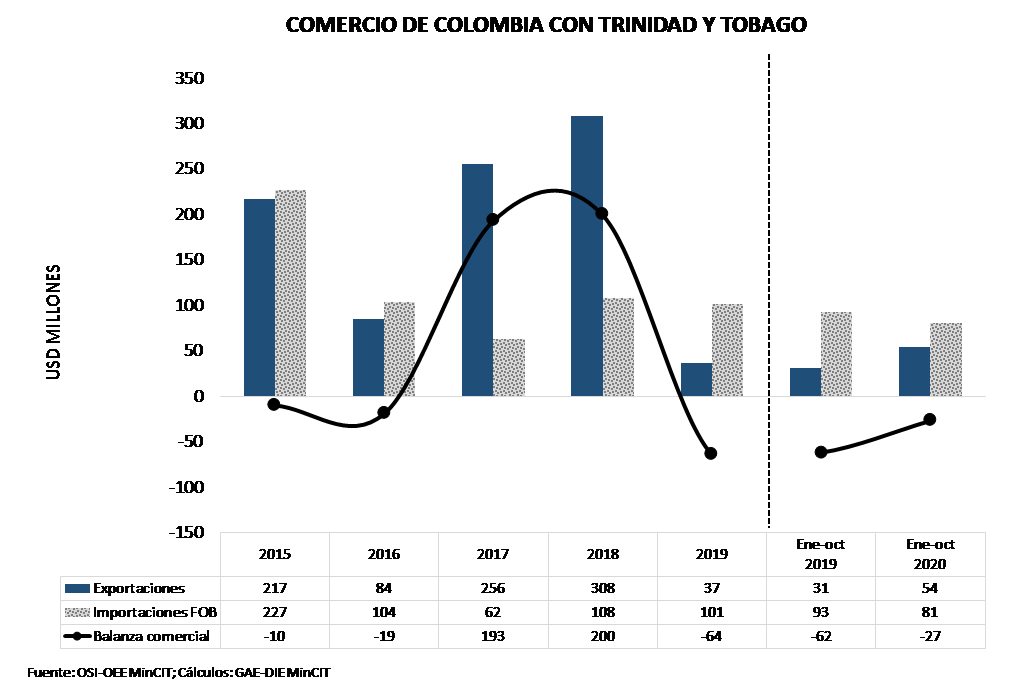
En 2019, la balanza comercial con Trinidad y Tobago fue deficitaria por USD 64 millones (la agrícola superavitaria en USD 10 millones y la industrial en USD 74 millones), con exportaciones de USD 37 millones (88% menos que en 2018), e importaciones de USD 101 millones (7% menos que 2018).
A octubre de 2020, la balanza comercial con Trinidad yTobago fue deficitaria en USD 27 millones (la agrícola superavitaria en USD 8 millones y la industrial deficitaria en USD 35 millones). Las exportaciones por valor de USD 54 millones (74% más que el mismo periodo del año anterior) y las importaciones por USD 81 millones (13% menos que el mismo periodo del año anterior).
Exportaciones
En 2019, el 0,09% de las exportaciones totales de Colombia se dirigió hacia Trinidad y Tobago (destino 53), y este mercado a su vez originó el 0,2% de las importaciones totales de Colombia (origen 40).
En 2019, los principales productos exportados fueron: acumuladores eléctricos (13%), azúcar de caña (10%), transformadores eléctricos (5%), barcos remolcadores (4%) y carbonatos y perococarbonos (4%).
El 98% de las exportaciones fueron NME (USD 36 millones).
Las agrícolas 3% del total (USD 3 millones) y las industriales 98% del total (USD 98 millones).
Las exportaciones manufactureras fueron el 87% del total (USD 32 millones).
Los principales departamentos que exportaron a este destino fueron: Bogotá D.C. (20%), Antioquia (19%), Valle Del Cauca (16%), Atlántico (14%) y Cauca (9%).
A octubre de 2020, los principales productos exportados fueron: aceites de petróleo livianos (51%), acumuladores eléctricos, incluidos sus separadores (6%), azúcar de caña o remolacha (5%), transformadores eléctricos (3%), grasas y aceites (3%).
El 49% de las exportaciones fueron NME (USD 27 millones).
Las agrícolas fueron el 19% del total (USD 10 millones) y las industriales el 81% del total (USD 44 millones). Las exportaciones manufactureras fueron el 93% del total (USD 50 millones). Los principales departamentos que exportaron a este destino fueron: departamentos varios (48%), Bogotá (12%), Antioquia (10%), Valle del Cauca (9%) y Bolívar (8%).
Importaciones
En 2019, los principales productos importados fueron: abonos minerales o químicos nitrogenados (39%), alcoholes acíclicos y sus derivados halogenados (26%), aceites de petróleos livianos y sus preparaciones (13%), amoniaco anhidro o en disolución acuosa (8%) y gas de petróleo (7%).
Las importaciones agrícolas fueron 3% del total (USD 3 millones) y las industriales el 97% del total (USD 98 millones). Los principales departamentos destino de las importaciones desde Trinidad y Tobago fueron: Bogotá (52%), Bolívar (23%), Atlántico (19%), Antioquia (4%) y Cundinamarca (2%).
A octubre 2020, los principales productos importados fueron: abonos minerales o químicos nitrogenados (48%), alcoholes acíclicos y sus derivados halogenados (18%), gas de petróleo y demás hidrocarburos gaseosos (14%), amoniaco anhidro o en disolución acuosa (8%) y pescado congelado (8%).
Las importaciones agrícolas fueron 2% del total (USD 2 millones) y las industriales el 98% del total (USD 79 millones). Los principales departamentos destino de las importaciones desde Trinidad y Tobago fueron: Bogotá (43%), Bolívar (26%), Atlántico (19%), Antioquia (6%) y Valle del Cauca (4%).
Inversión
Según cifras del Banco de la República, en el 2019 no se registran flujos de IED de Trinidad y Tobago en Colombia., así como tampoco flujo de IED de Colombia en Trinidad y Tobago.
A primer semestre de 2020, no se registran flujos de IED entre Colombia y Trinidad y Tobago. Se tiene un acumulado de USD 7 millones de IED desde 1994, de Colombia en TyT.
Turismo
En el año 2019, ingresaron 1.644 turistas de Trinidad y Tobago a Colombia (14% menos que en 2018 cuando ingresaron 1.914) y 1.243 colombianos eligieron a Trinidad y Tobago como destino turístico (31% más que en 2018, cuando salieron 952 turistas).
A octubre de 2020, se registró un ingreso de 282 turistas de Trinidad y Tobago en Colombia; a su vez, 252 viajeros colombianos eligieron Trinidad y Tobago como destino turístico.
*Fuentes: Cifras tomadas del Observatorio-OEE. Expo 04/12/2020 / Impo 23/12/2020. Elaboró Ministerio de Comercio, Industria y Turismo.
Trade Balance
As of October 2020, the trade balance was USD 27 million in deficit (agricultural surplus in USD 8 million and industrial deficit in USD 35 million). With exports of USD 54 million (74% more than what was exported in the same period of 2019) and with imports of USD 81 million (13% less than what was imported in the same period of 2019).
As of 2019, the trade balance was USD 64 million in deficit (agricultural surplus in USD 10 million and industrial deficit in USD 74 million). With exports of USD 37 million (88% less than what was exported in 2018) and with imports of USD 101 million (7% less than what was imported in 2018).
Exports
In 2019, 0.09% of Colombia's total exports went to Trinidad and Tobago (destination 53), and this market in turn originated 0.2% of Colombia's total imports (origin 40).
In 2019, the main exported products were: electrical accumulators (13%), cane sugar (10%), electrical transformers (5%), tug boats (4%) and carbonates and perococarbons (4%). 98% of exports were NME (USD 36 million). Agriculture 3% of the total (USD 3 million) and industrial 98% of the total (USD 98 million).
Manufacturing exports were 87% of the total (USD 32 million). The main departments that exported to this destination were: Bogotá D.C. (20%), Antioquia (19%), Valle Del Cauca (16%), Atlántico (14%) and Cauca (9%).
As of October 2020, the main exported products were: light petroleum oils (51%), electrical accumulators, including their separators (6%), cane or beet sugar (5%), electrical transformers (3%), fats and oils (3%). 49% of exports were NME (USD 27 million).
The agricultural ones were 19% of the total (USD 10 million) and the industrial ones 81% of the total (USD 44 million). Manufacturing exports were 93% of the total (USD 50 million). The main departments that exported to this destination were: various departments (48%), Bogotá (12%), Antioquia (10%), Valle del Cauca (9%) and Bolívar (8%).
Imports
In 2019, the main imported products were: mineral or chemical nitrogenous fertilizers (39%), acyclic alcohols and their halogenated derivatives (26%), light petroleum oils and their preparations (13%), anhydrous ammonia or in aqueous solution (8 %) and petroleum gas (7%).
Agricultural imports were 3% of the total (USD 3 million) and industrial imports 97% of the total (USD 98 million). The main destination departments for imports from Trinidad and Tobago were: Bogotá (52%), Bolívar (23%), Atlántico (19%), Antioquia (4%) and Cundinamarca (2%).
As of October 2020, the main imported products were: mineral or chemical nitrogen fertilizers (48%), acyclic alcohols and their halogenated derivatives (18%), petroleum gas and other gaseous hydrocarbons (14%), anhydrous ammonia or in aqueous solution ( 8%) and frozen fish (8%).
Agricultural imports were 2% of the total (USD 2 million) and industrial imports were 98% of the total (USD 79 million). The main destination departments for imports from Trinidad and Tobago were: Bogotá (43%), Bolívar (26%), Atlántico (19%), Antioquia (6%) and Valle del Cauca (4%).
Investment
According to figures from the Central Bank of Colombia, in 2019 there were no FDI flows from Trinidad and Tobago in Colombia, as well as no FDI flows from Colombia in Trinidad and Tobago.
In the first half of 2020, there are no FDI flows between Colombia and Trinidad and Tobago. There has been an accumulated USD 7 million of FDI since 1994, from Colombia in T&T.
Tourism
In 2019, 1,644 tourists from Trinidad and Tobago entered Colombia (14% less than in 2018 when 1,914 entered) and 1,243 Colombians chose Trinidad and Tobago as a tourist destination (31% more than in 2018, when 952 tourists left).
As of October 2020, 282 tourists from Trinidad and Tobago had entered Colombia; in turn, 252 Colombian travelers chose Trinidad and Tobago as their tourist destination.
* Sources: Figures taken from the Observatory-OEE. Expo 04/12/2020 / Impo 23/12/2020. Prepared by the Ministry of Commerce, Industry and Tourism.
Barbados
Balanza Comercial
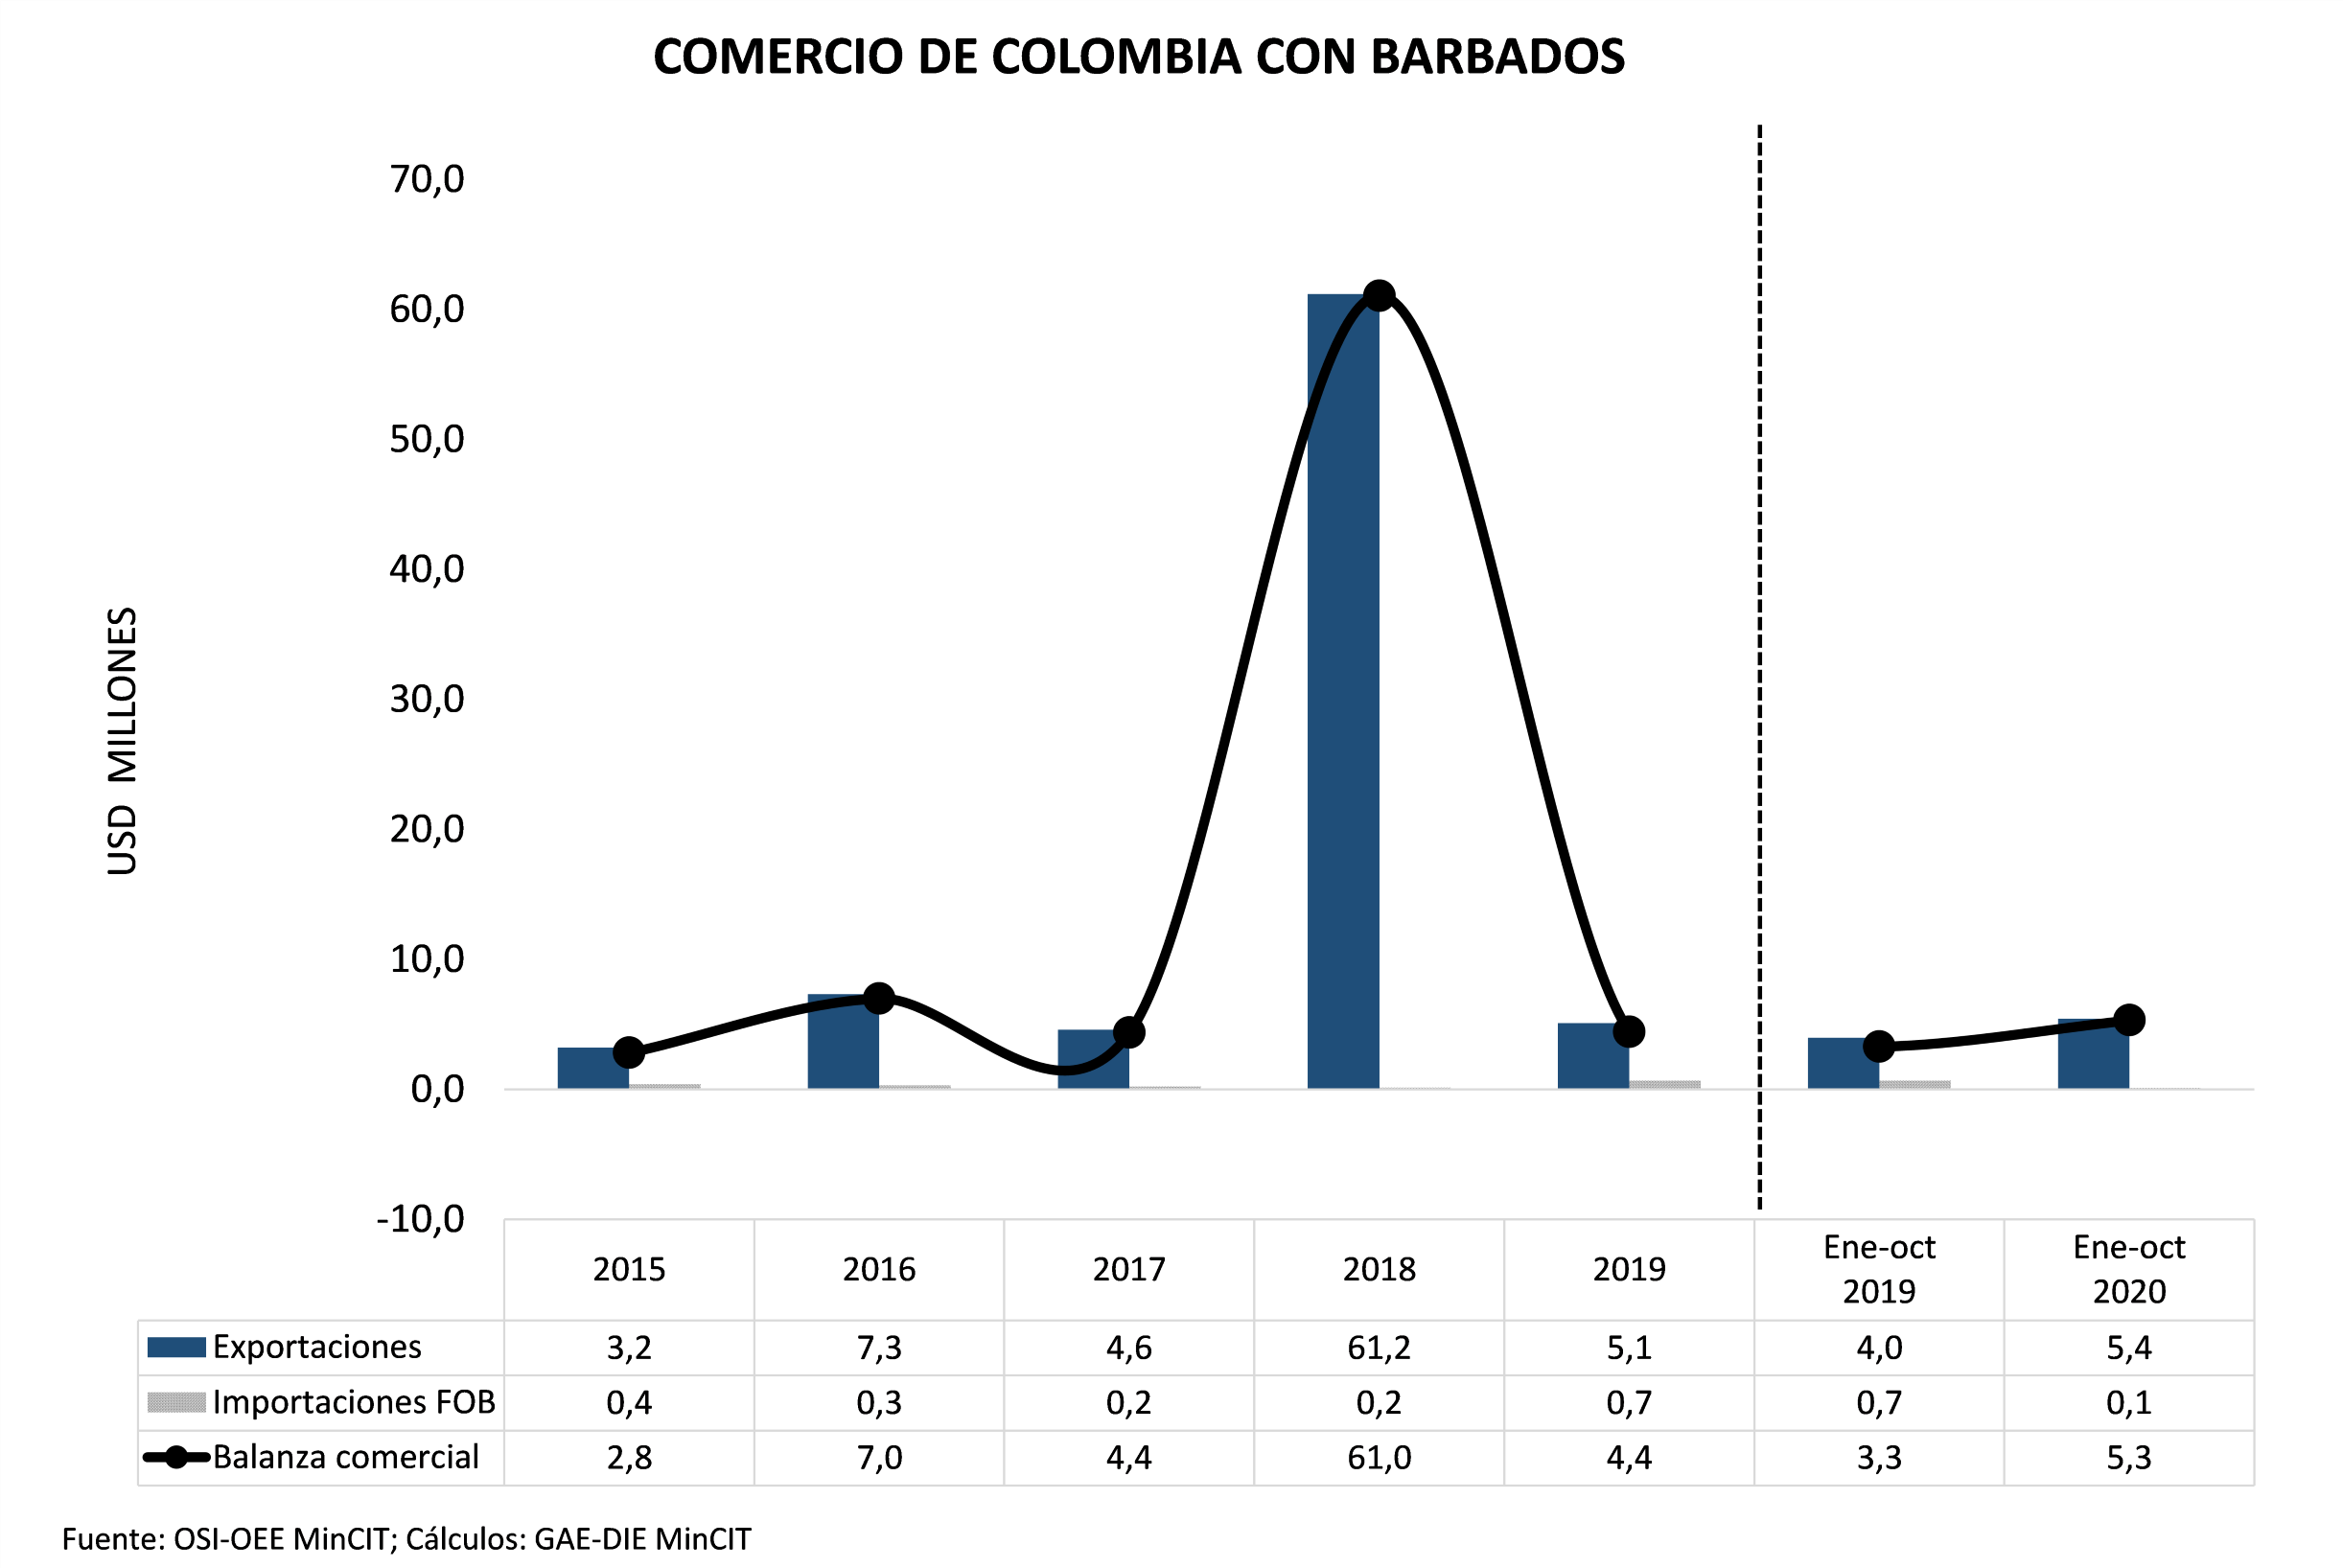
En el año 2019, la balanza comercial con Barbados registró un superávit de USD 4,4 millones (la agrícola en USD 1,7 millones y la industrial en USD 2,7 millones), con exportaciones de USD 5,1 millones (92% menos que en 2018), y con importaciones de USD 0,7 millones (350% más que en el año anterior).
A octubre de 2020, la balanza comercial fue superavitaria para Colombia en USD 5 millones (la agrícola en USD 2 millones y la industrial en USD 3 millones). Las exportaciones fueron de USD 5,4 millones (37% más que lo registrado el mismo periodo del año anterior) y las importaciones fueron de USD 0,1 millones (81% menos que el año anterior).
En 2019, el 0,01% de las exportaciones totales de Colombia se dirigió hacia Barbados (destino 96), y este a su vez originó el 0,001% de las importaciones totales de Colombia (origen 296).
Exportaciones
En el año 2019, el 100% de los productos exportados hacia este destino fueron NME (USD 5,1 millones), de los cuales los principales fueron: azúcar de caña o remolacha (11%), malta 10%), envases de plástico (9%), barriles, botes, cajas; de aluminio (9%) e insecticidas, fungicidas y herbicidas (4%).
Las exportaciones agrícolas fueron USD 1,7 millones (34% del total) y las industriales de USD 3,4 millones (66% del total).
Las exportaciones manufactureras fueron USD 4,9 millones (96% del total).
Los principales departamentos que exportaron hacia Barbados en el 2018 fueron: Bogotá (27%), Bolívar (20%), Antioquia (15%), Atlántico (13%) y Valle del Cauca (9%).
A octubre de 2020, el 100% de las exportaciones fueron NME (USD 5,3 millones). Los principales productos exportados hacia este destino fueron: melaza procedente de la extracción del azúcar (15%), malta (10%), envases de plástico (8%), barriles, botes, cajas; de aluminio (7%) y discos para grabar sonido o imágenes (7%).
Las exportaciones agrícolas fueron USD 0,03 millones (1% del total) y las industriales de USD 5,37 millones (99% del total).
Las exportaciones manufactureras fueron USD 5,3 millones (97% del total).
Para este periodo, los principales departamentos que exportaron a este destino fueron: Valle Del Cauca (27%), Bogotá D.C. (23%), Bolívar (15%), Antioquia (14%) y Cauca (8%).
Importaciones
En el año 2019, el 100% de las importaciones fueron industriales (USD 0,7 millones). Los principales productos importados fueron: alcoholes acíclicos y sus derivados halogenados (87%), tubos y perfiles huecos, de hierro o acero (6%), discos para grabar sonido o imágenes (5%) y circuitos integrados y microestructuras electrónicas (1%).
Los principales departamentos que importaron desde Barbados fueron: Bogotá (98%), y Cundinamarca (1%).
Inversión
A octubre de 2020, los principales productos importados fueron: camisas de punto para hombres o niños (73%), papel o cartón para reciclar (8%), licores (8%), camisetas de punto (5%) y confecciones de punto, femeninos (3%).
El 92% de las importaciones fueron industriales (USD 119 mil) y las agrícolas 8% (USD 10 mil).
Según cifras del Banco de la Republica, durante el 2019 la IED de Barbados a Colombia fue de USD 388 millones. Igualmente, para este periodo el IED de Colombia en Barbados fue de USD 24 millones.
A primer semestre de 2020, la IED de Barbados en Colombia fue de USD 65 millones (acumulado de USD 3.623 millones, desde 1994). Para este mismo periodo, la IED de Colombia en Barbados fue de USD 0,1 millones (acumulado de USD 165 millones, desde 1994).
Turismo
En el año 2019, se registró el ingreso de 335 turistas de Barbados a Colombia (35% menos que lo registrado en 2018 cuando ingresaron 514 turistas). Asimismo, se registró la visita de 308 colombianos a Barbados (14% más que lo registrado en 2018 cuando ingresaron 271 turistas).
A octubre de 2020, se registró un ingreso de 48 turistas de Barbados en Colombia; a su vez, 102 viajeros colombianos eligieron Barbados como destino turístico
*Fuentes: Cifras tomadas del Observatorio-OEE. Exportaciones 04/12/2020 - Importaciones 23/12/2020 Elaboró Ministerio de Comercio, Industria y Turismo.
Trade Balance
In 2019, the trade balance with Barbados registered a surplus of USD 4.4 million (agricultural in USD 1.7 million and industrial in USD 2.7 million), with exports of USD 5.1 million (92% less than in 2018), and with imports of USD 0.7 million (350% more than in the previous year).
As of October 2020, the trade balance had a surplus for Colombia by USD 5 million (agricultural by USD 2 million and industrial by USD 3 million). Exports were USD 5.4 million (37% more than the same period of the previous year) and imports were USD 0.1 million (81% less than the previous year).
In 2019, 0.01% of Colombia's total exports went to Barbados (destination 96), and this in turn originated 0.001% of Colombia's total imports (origin 296).
Exports
In 2019, 100% of the products exported to this destination were NME (USD 5.1 million), of which the main ones were: cane or beet sugar (11%), malt 10%), plastic containers (9%), barrels, cans, boxes; aluminum (9%) and insecticides, fungicides and herbicides (4%).
Agricultural exports were USD 1.7 million (34% of the total) and industrial exports were USD 3.4 million (66% of the total).
Manufacturing exports were USD 4.9 million (96% of the total).
The main departments that exported to Barbados in 2018 were: Bogotá (27%), Bolívar (20%), Antioquia (15%), Atlántico (13%) and Valle del Cauca (9%).
As of October 2020, 100% of exports were NME (USD 5.3 million). The main products exported to this destination were: molasses from sugar extraction (15%), malt (10%), plastic containers (8%), barrels, jars, boxes; aluminum (7%) and discs for recording sound or images (7%).
Agricultural exports were USD 0.03 million (1% of the total) and industrial exports were USD 5.37 million (99% of the total).
Manufacturing exports were USD 5.3 million (97% of the total). For this period, the main departments that exported to this destination were: Valle Del Cauca (27%), Bogotá D.C. (23%), Bolívar (15%), Antioquia (14%) and Cauca (8%).
Imports
In 2019, 100% of imports were industrial (USD 0.7 million). The main imported products were: acyclic alcohols and their halogenated derivatives (87%), tubes and hollow profiles, made of iron or steel (6%), discs for recording sound or images (5%) and integrated circuits and electronic microstructures (1% ).
The main departments that imported from Barbados were: Bogotá (98%), and Cundinamarca (1%).
Investment
As of October 2020, the main imported products were: knitted shirts for men or boys (73%), paper or cardboard for recycling (8%), spirits (8%), knitted shirts (5%) and knitwear , female (3%). 92% of imports were industrial (USD 119 thousand) and agricultural 8% (USD 10 thousand).
According to figures from the Banco de la Republica, during 2019 the FDI from Barbados to Colombia was USD 388 million. Similarly, for this period, FDI from Colombia in Barbados was USD 24 million.
In the first half of 2020, Barbados' FDI in Colombia was USD 65 million (accumulated USD 3,623 million, since 1994). For this same period, FDI from Colombia in Barbados was USD 0.1 million (accumulated of USD 165 million, since 1994).
Tourism
In 2019, the entry of 335 tourists from Barbados to Colombia was registered (35% less than what was registered in 2018 when 514 tourists entered). Likewise, 308 Colombians visited Barbados (14% more than what was registered in 2018 when 271 tourists entered).
As of October 2020, there was an entry of 48 tourists from Barbados in Colombia; in turn, 102 Colombian travelers chose Barbados as a tourist destination
* Sources: Figures taken from the Observatory-OEE. Exports 12/04/2020 - Imports 12/23/2020 Prepared by the Ministry of Commerce, Industry and Tourism.
Granada
Balanza Comercial
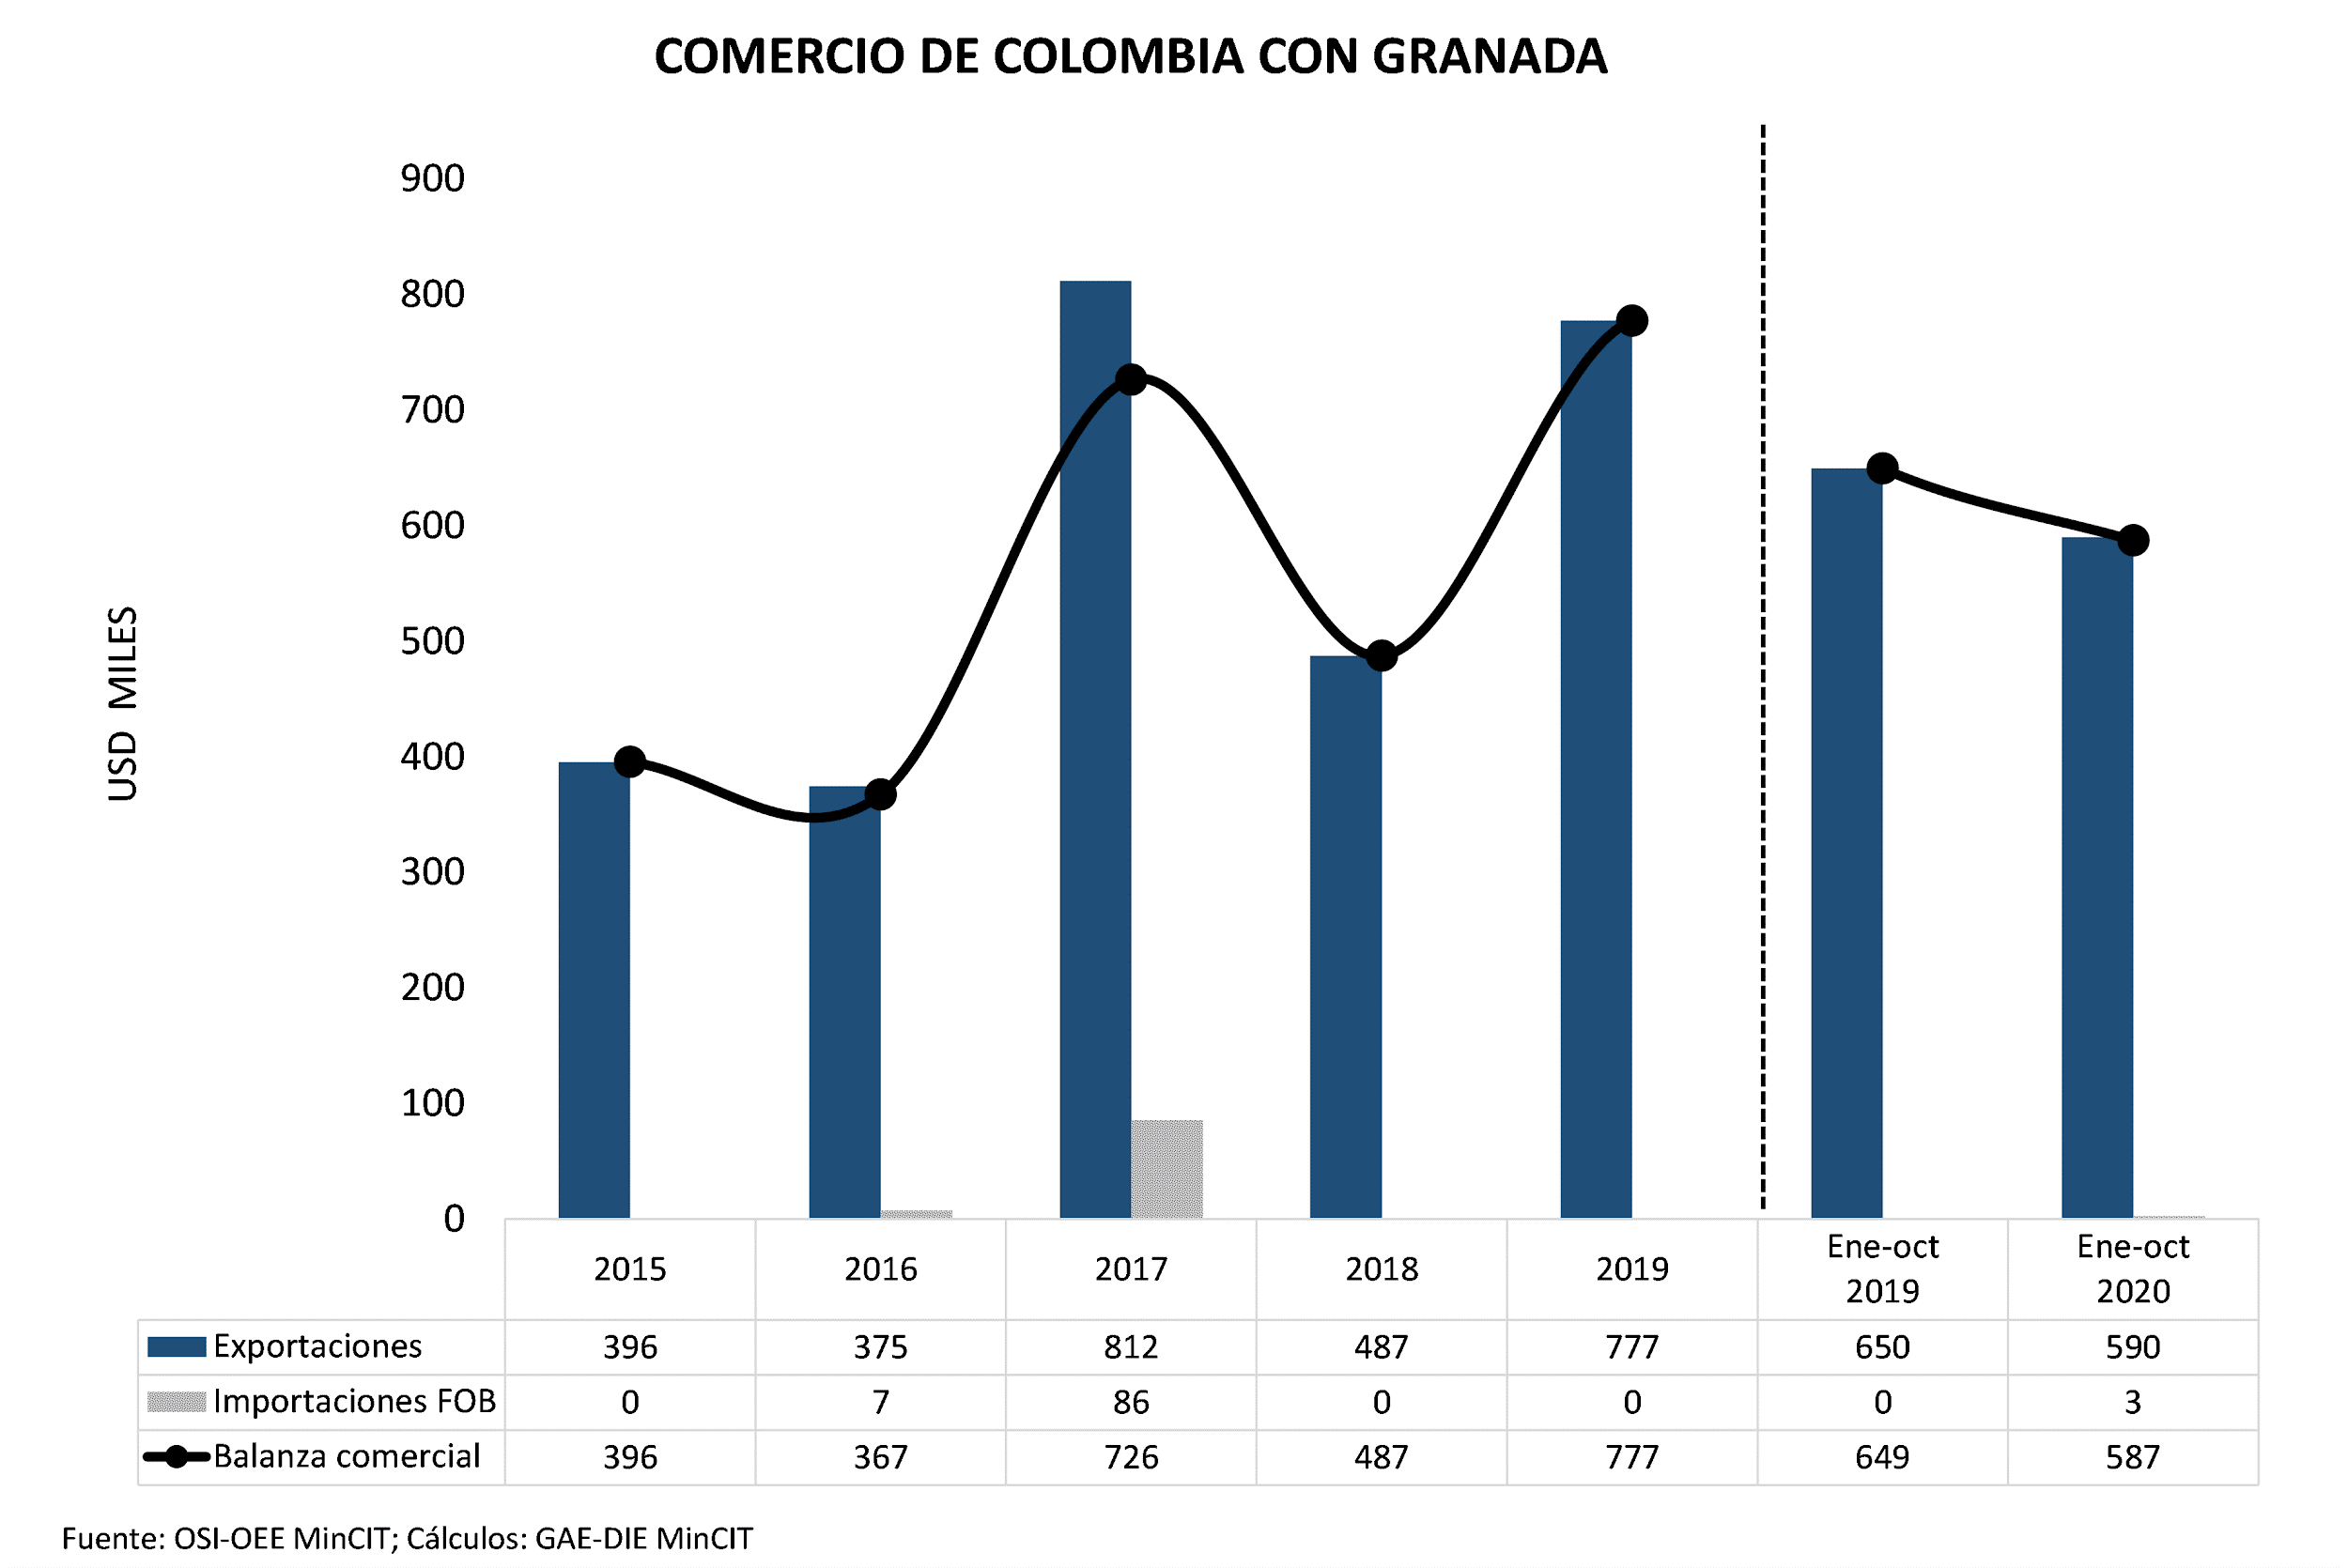
Tradicionalmente la balanza comercial con Granada es superavitaria para Colombia. En 2019, por USD 777,2 mil (la agrícola USD 420 mil y la industrial en USD 357,2 mil). Con exportaciones de USD 777,4 mil (60% más respecto a 2018) e importaciones por USD 0,2 mil.
A octubre de 2020, la balanza comercial fue superavitaria para Colombia en USD 587 mil (la agrícola en USD 127 mil y la industrial en USD 460 mil). Las exportaciones fueron de USD 590 mil (9% menos que lo registrado el mismo periodo del año anterior) y las importaciones fueron de USD 3 mil (1422% más que lo registrado el mismo periodo del año anterior).
En 2019, el 0,002% de las exportaciones totales de Colombia se dirigió hacia Granada (destino 139) y fue el origen 231 de las importaciones de Colombia.
Exportaciones
En el año 2019, el 100% de las exportaciones fueron NME, destacándose: azúcar (40%), productos de panadería y pastelería (9%), baúles y maletas de cuero (9%), calzado (6%) y vajillas (6%).
Las exportaciones agrícolas fueron USD 420 mil (54% del total) y las industriales fueron USD 357,4 mil (46% del total). Las exportaciones manufactureras fueron USD 746 mil (96% del total).
Los principales departamentos que exportaron hacia Granada fueron: Cauca (39%), Bogotá (21%), Antioquia (14%), Bolívar (11%) y Cundinamarca (8%).
A octubre de 2020, los principales productos exportados a este destino son 100% NME, de los cuales se destacan: máquinas para preparación industrial de alimentos o bebidas (41%), baúles, maletines y maletas de cuero (11%), azúcar de caña o remolacha (9%), productos de panadería, pastelería o galletería (9%) y manufacturas de hierro o acero (4%).
Las exportaciones agrícolas fueron de USD 127 miles (22% del total) y las industriales de USD 463 miles (78% del total).
El 100% de las exportaciones son manufacturas.
Para este periodo los principales departamentos que exportaron a este destino fueron: Antioquia (62%), Bogotá D.C. (16%), Cauca (9%), Atlántico (6%) y Caldas (3%).
Importaciones
En el 2019 los principales productos importados fueron: envases de plástico (77%) y papeles y cartón (23%). El 100% fueron industriales (USD 183) y con departamento de compra Bogotá.
A octubre de 2020, el principal producto importado desde este destino fue papel y guata de celulosa (100% industrial) e importado desde Bogotá.
Inversión
Según cifras del Banco de la República, no se registró IED entre Granada y Colombia.
Turismo
En el año 2019, ingresaron 83 turistas de Granada a Colombia y 25 turistas colombianos visitaron Granada.
A octubre de 2020, se registró un ingreso de 21 turistas de Granada en Colombia; a su vez, 2 viajeros colombianos eligieron Granada como destino turístico.
*Fuentes: Cifras tomadas del Observatorio-OEE. Exportaciones 04/12/2020 - Importaciones 23/12/2020 Elaboró Ministerio de Comercio, Industria y Turismo.
Trade Balance
Traditionally, the trade balance with Grenada is a surplus for Colombia. In 2019, for USD 777.2 thousand (agricultural USD 420 thousand and industrial USD 357.2 thousand). With exports of USD 777.4 thousand (60% more compared to 2018) and imports for USD 0.2 thousand.
As of October 2020, the trade balance was in surplus for Colombia by USD 587 thousand (agricultural by USD 127 thousand and industrial by USD 460 thousand). Exports were USD 590 thousand (9% less than that registered in the same period of the previous year) and imports were USD 3,000 (1422% more than that registered in the same period of the previous year).
In 2019, 0.002% of Colombia's total exports went to Grenada (destination 139) and was the source of 231 of Colombia's imports.
Exports
In 2019, 100% of exports were NME, standing out: sugar (40%), bakery and pastry products (9%), leather trunks and suitcases (9%), footwear (6%) and tableware ( 6%).
Agricultural exports were USD 420 thousand (54% of the total) and industrial exports were USD 357.4 thousand (46% of the total). Manufacturing exports were USD 746 thousand (96% of the total).
The main departments that exported to Grenada were: Cauca (39%), Bogotá (21%), Antioquia (14%), Bolívar (11%) and Cundinamarca (8%).
As of October 2020, the main products exported to this destination are 100% NME, of which the following stand out: machines for industrial preparation of food or beverages (41%), leather trunks, briefcases and suitcases (11%), sugar cane or beet (9%), bakery, pastry or biscuit products (9%) and iron or steel articles (4%).
Agricultural exports were USD 127 thousand (22% of the total) and industrial exports were USD 463 thousand (78% of the total).
100% of exports are manufactures.
For this period, the main departments that exported to this destination were: Antioquia (62%), Bogotá D.C. (16%), Cauca (9%), Atlántico (6%) and Caldas (3%).
Imports
In 2019 the main imported products were: plastic containers (77%) and paper and cardboard (23%). 100% were industrial (USD 183) and with a purchasing department in Bogotá.
As of October 2020, the main product imported from this destination was paper and cellulose wadding (100% industrial) and imported from Bogotá.
Investment
According to figures from the Banco de la República, there was no FDI between Grenada and Colombia.
Tourism
In 2019, 83 tourists from Grenada entered Colombia and 25 Colombian tourists visited Grenada.
As of October 2020, there was an entry of 21 tourists from Grenada in Colombia; in turn, 2 Colombian travelers chose Grenada as their tourist destination.
* Sources: Figures taken from the Observatory-OEE. Exports 12/04/2020 - Imports 12/23/2020 Prepared by the Ministry of Commerce, Industry and Tourism.
Guyana
Balanza Comercial
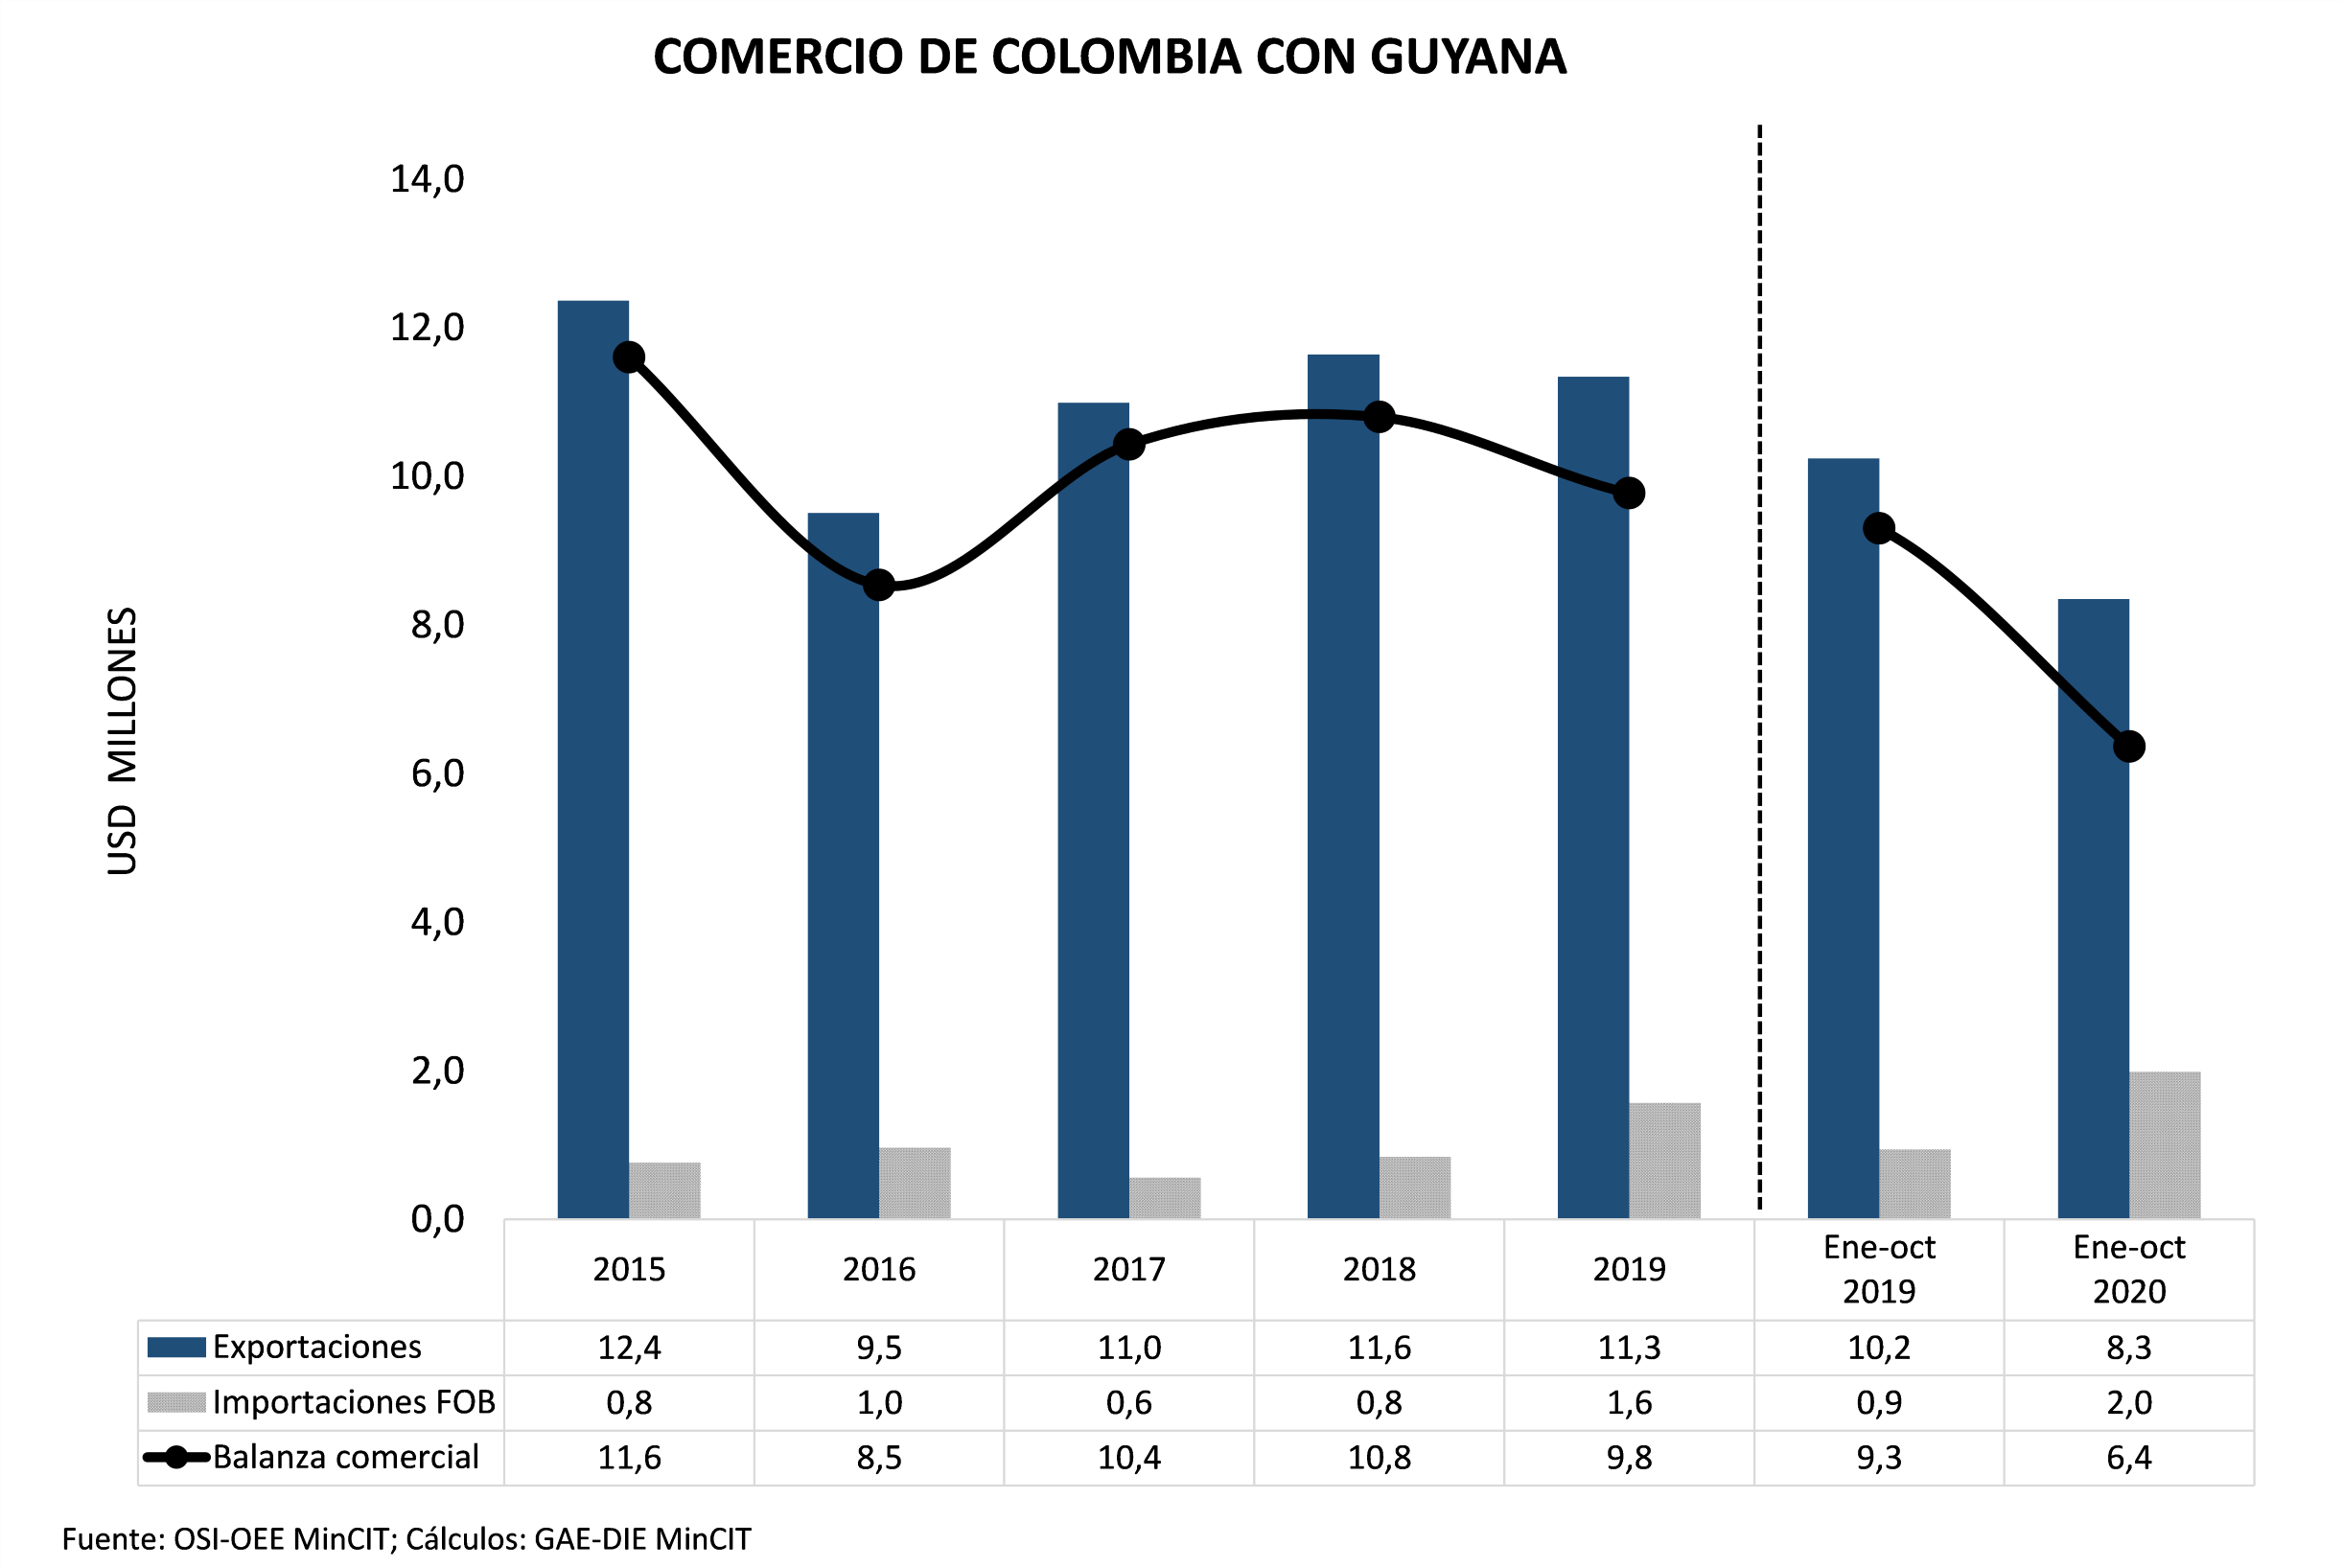
Tradicionalmente la balanza comercial con Guyana es superavitaria para Colombia. En 2019, por USD 9 millones (la agrícola en USD 2 millones y la industrial en USD 7 millones), con exportaciones de USD 11 millones (3% menos que 2018), e importaciones de USD 2 millones (86% más que 2018).
A octubre de 2020, la balanza comercial fue superavitaria para Colombia en USD 6,4 millones (la agrícola en USD 0,2 millones y la industrial en USD 6,2 millones). Las exportaciones fueron de USD 8,4 millones (19% menos que lo registrado el periodo anterior) y las importaciones fueron de USD 2 millones (110% menos/más que lo registrado el mismo periodo del año anterior).
En 2019, el 0,03% de las exportaciones totales de Colombia se dirigió hacia Guyana (destino 79), y este mercado a su vez originó el 0,003% de las importaciones totales de Colombia (origen 116).
Exportaciones
En el 2019, el 100% fueron NME, destacándose: acumuladores eléctricos (17%), azúcar (11%), poli acetales (10%), preparaciones para lavar (8%) y envases de plástico (7%).
Las exportaciones agrícolas fueron USD 3 millones (28% del total) y las industriales fueron USD 8 millones (72% del total). Las exportaciones manufactureras fueron USD 11 millones (97% del total).
Los principales departamentos que exportaron hacia Guyana fueron: Valle del Cauca (27%), Bolívar (21%), Bogotá (20%), Antioquia (15%) y Atlántico (6%).
A octubre de 2020, los principales productos exportados a este destino fueron: acumuladores eléctricos, incluidos sus separadores (20%), transformadores eléctricos, (15%), envases de plástico (10%), preparaciones para lavar (7%) y azúcar de caña o remolacha (6%).
Las exportaciones agrícolas fueron de USD 1,8 millón (22% del total) y las industriales de USD 6,5 millones (78% del total).
Durante este periodo, el 93% de las exportaciones NME fueron (USD 8 millones) y las exportaciones de manufacturas fueron de USD 8 millones (97% del total).
Para este periodo los principales departamentos que exportaron a este destino fueron: Antioquia (37%), Valle Del Cauca (32%), Bogotá (18%), Atlántico (4%) y Magdalena (4%).
Importaciones
En el año 2019, los productos importados fueron: salvados, moyuelos y residuos del cernido (65%) y minerales de aluminio (35%).
Las importaciones agrícolas fueron 65% del total (USD 1 millón) y las industriales 35% (USD 0,6 millones) del total.
Los principales departamentos importadores fueron: Antioquia (50%), Atlántico (37%), Valle del Cauca (11%), Bogotá (2%) y Santander (1%).
A octubre de 2020, los principales productos importados desde este destino fueron: salvados y moyuelos cernido (86%), minerales de aluminio y sus concentrados (12%) y máquinas para preparación industrial de alimentos o bebidas (2%).
Las importaciones agrícolas fueron de USD 1,7 millones (86% del total) y las industriales de USD 0,3 millones (14% del total).
Para este periodo, los principales departamentos de importación fueron: Antioquia (124%), Santander (33%), Valle Del Cauca (20%), Atlántico (17%) y Bogotá (5%).
Inversión
Según cifras del Banco de la República, no se presentan flujos de Inversión Extranjera Directa (IED) entre Guyana y Colombia.
Turismo
En el año 2019, se registró un ingreso de 494 turistas de Guyana en Colombia (7% menos que en 2018, cuando ingresaron 532 turistas). Al mismo tiempo, 297 colombianos eligieron como destino turístico Guyana (53% más que en 2018, cuando salieron 194 turistas).
A octubre de 2020, se registró un ingreso de 71 turistas de Guyana en Colombia; a su vez, 85 viajeros colombianos eligieron Guyana como destino turístico
*Fuentes: Cifras tomadas del Observatorio-OEE. Exportaciones 04/12/2020 - Importaciones 23/12/2020 Elaboró Ministerio de Comercio, Industria y Turismo.
Trade Balance
Traditionally, the trade balance with Guyana is a surplus for Colombia. In 2019, for USD 9 million (agricultural in USD 2 million and industrial in USD 7 million), with exports of USD 11 million (3% less than 2018), and imports of USD 2 million (86% more than 2018).
As of October 2020, the trade balance was in surplus for Colombia by USD 6.4 million (agricultural by USD 0.2 million and industrial by USD 6.2 million). Exports were USD 8.4 million (19% less than the previous period) and imports were USD 2 million (110% less / more than the same period of the previous year).
In 2019, 0.03% of Colombia's total exports went to Guyana (destination 79), and this market in turn originated 0.003% of Colombia's total imports (origin 116).
Exports
In 2019, 100% were NME, standing out: electrical accumulators (17%), sugar (11%), poly acetals (10%), laundry preparations (8%) and plastic containers (7%).
Agricultural exports were USD 3 million (28% of the total) and industrial exports were USD 8 million (72% of the total). Manufacturing exports were USD 11 million (97% of the total).
The main departments that exported to Guyana were: Valle del Cauca (27%), Bolívar (21%), Bogotá (20%), Antioquia (15%) and Atlántico (6%).
As of October 2020, the main products exported to this destination were: electrical accumulators, including their separators (20%), electrical transformers (15%), plastic containers (10%), laundry preparations (7%) and sugar cane or beet (6%).
Agricultural exports were USD 1.8 million (22% of the total) and industrial exports were USD 6.5 million (78% of the total).
During this period, 93% of NME exports were (USD 8 million) and manufacturing exports were USD 8 million (97% of the total).
For this period, the main departments that exported to this destination were: Antioquia (37%), Valle Del Cauca (32%), Bogotá (18%), Atlántico (4%) and Magdalena (4%).
Imports
In 2019, imported products were: bran, sharps and sifting residues (65%) and aluminum minerals (35%).
Agricultural imports were 65% of the total (USD 1 million) and industrial imports 35% (USD 0.6 million) of the total.
The main importing departments were: Antioquia (50%), Atlántico (37%), Valle del Cauca (11%), Bogotá (2%) and Santander (1%).
As of October 2020, the main products imported from this destination were: bran and sifted sharps (86%), aluminum minerals and their concentrates (12%) and machines for industrial preparation of food or beverages (2%).
Agricultural imports were USD 1.7 million (86% of the total) and industrial imports were USD 0.3 million (14% of the total).
For this period, the main departments which import were: Antioquia (124%), Santander (33%), Valle Del Cauca (20%), Atlántico (17%) and Bogotá (5%).
Investment
According to figures from the Banco de la República, there are no Foreign Direct Investment (FDI) flows between Guyana and Colombia.
Tourism
In 2019, 494 Guyanese tourists entered Colombia (7% less than in 2018, when 532 tourists entered). At the same time, 297 Colombians chose Guyana as their tourist destination (53% more than in 2018, when 194 tourists left).
As of October 2020, 71 Guyanese tourists entered Colombia; in turn, 85 Colombian travelers chose Guyana as a tourist destination
* Sources: Figures taken from the Observatory-OEE. Exports 12/04/2020 - Imports 12/23/2020 Prepared by the Ministry of Commerce, Industry and Tourism.
San Vicente y las Granadinas
Balanza Comercial
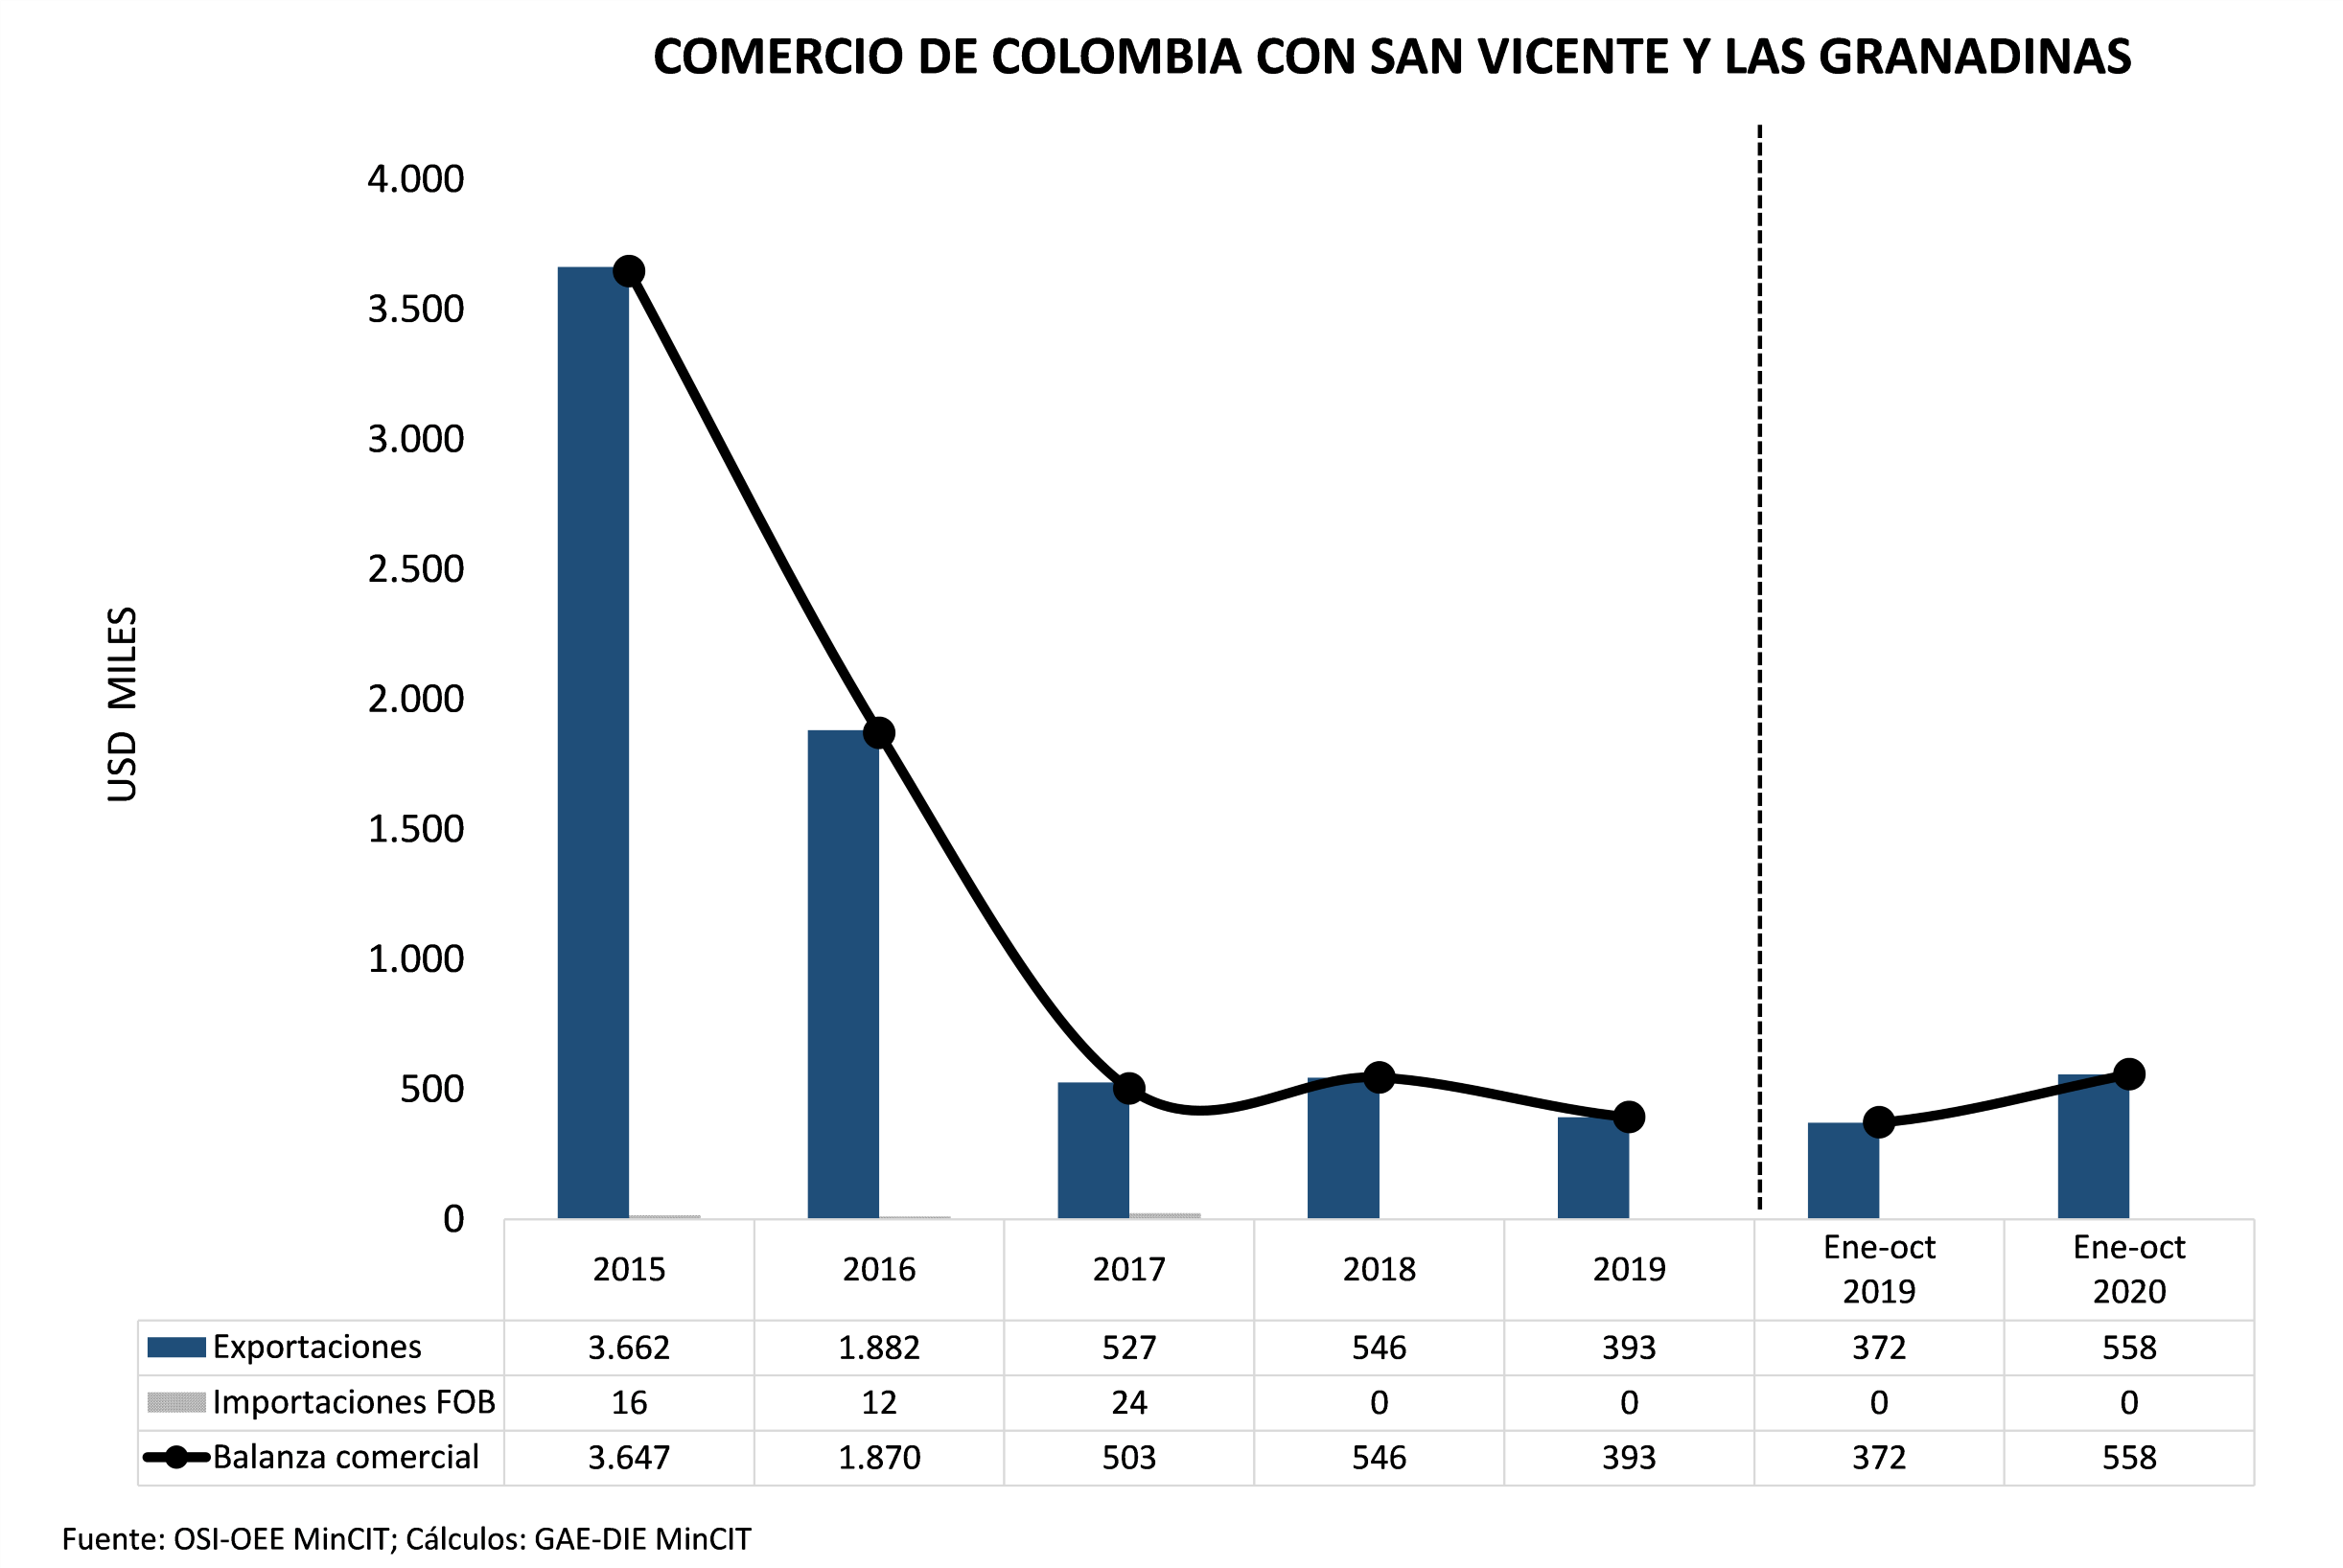
Tradicionalmente, la balanza comercial con San Vicente y Las Granadinas es superavitaria para Colombia. En 2019, registró un superávit de USD 393 mil (la agrícola en USD 323 mil y la industrial en USD 70 mil). Las exportaciones fueron de USD 393 mil (28% menos que 2018) y no se reportó valor de importaciones.
A octubre de 2020, la balanza comercial fue superavitaria para Colombia en USD 558 miles (la agrícola en USD 482 mil y la industrial en USD 76 mil). Exportaciones por valor de USD 558 mil (50% más que el mismo periodo del año anterior) y no se registraron importaciones.
En 2019, el 0,001% de las exportaciones totales de Colombia se dirigió hacia San Vicente y Las Granadinas (destino 148). No se registraron importaciones.
Exportaciones
En 2019, el 100% de los productos exportados fueron NME, destacando: azúcar (30%), productos de panadería, (28%), artículos de confitería sin cacao (10%), baúles y maletas (9%) y malta (8%).
Las exportaciones agrícolas fueron USD 323 mil (82% del total) y las industriales fueron USD 70 mil (18% del total).
Los principales departamentos que exportaron a este destino fueron: Antioquia (30%), Cauca (30%), Valle Del Cauca (17%), Bogotá (12%) y Cundinamarca (10%).
A octubre de 2020, el 99% de las exportaciones fueron NME (USD 550 mil). Los principales productos exportados a este destino fueron: malta (33%), azúcar de caña o remolacha (20%), productos de panadería, pastelería o galletería (18%), artículos de confitería sin cacao (8%) y máquinas mecánicas con función propia (7%).
Las exportaciones agrícolas fueron de USD 482 mil (86% del total) y las industriales de USD 76 mil (14% del total).
Las exportaciones de manufacturas fueron de USD 540 mil (97% del total).
Para este periodo los principales departamentos que exportaron a este destino fueron: Bolívar (33%), Antioquia (20%), Valle Del Cauca (13%), Cauca (11%) y Risaralda (9%).
Importaciones
No se registran importaciones en 2019.
No se registran importaciones a octubre 2020.
Inversión
Según cifras del Banco de la República, no se registran flujos de IED con San Vicente y Las Granadinas.
Turismo
En el 2019, ingresaron 69 turistas de San Vicente y Las Granadinas a Colombia (34% menos que lo registrado en 2018 cuando ingresaron 105) Asimismo, 15 colombianos eligieron la isla de San Vicente y Las Granadinas como destino turístico (15% más que en 2018 cuando salieron 13 colombianos).
*Fuentes: Cifras tomadas del Observatorio-OEE. Exportaciones 04/12/2020 - Importaciones 23/12/2020 Elaboró Ministerio de Comercio, Industria y Turismo.
Trade Balance
Traditionally, the trade balance with Saint Vincent and the Grenadines is a surplus for Colombia. In 2019, it registered a surplus of USD 393 thousand (agricultural in USD 323 thousand and industrial in USD 70 thousand). Exports were USD 393 thousand (28% less than 2018) and no value of imports was reported.
As of October 2020, the trade balance was in surplus for Colombia by USD 558 thousand (agricultural by USD 482 thousand and industrial by USD 76 thousand). Exports worth USD 558 thousand (50% more than the same period of the previous year) and no imports were registered.
In 2019, 0.001% of Colombia's total exports went to Saint Vincent and the Grenadines (destination 148). No imports were recorded.
Exports
In 2019, 100% of exported products were NME, highlighting: sugar (30%), bakery products (28%), confectionery without cocoa (10%), trunks and suitcases (9%) and malt ( 8%).
Agricultural exports were USD 323 thousand (82% of the total) and industrial exports were USD 70 thousand (18% of the total).
The main departments that exported to this destination were: Antioquia (30%), Cauca (30%), Valle Del Cauca (17%), Bogotá (12%) and Cundinamarca (10%).
As of October 2020, 99% of exports were NME (USD 550 thousand). The main products exported to this destination were: malt (33%), cane or beet sugar (20%), bakery, pastry or biscuit products (18%), confectionery without cocoa (8%) and mechanical machines with their own function (7%).
Agricultural exports were USD 482 thousand (86% of the total) and industrial exports were USD 76 thousand (14% of the total).
Manufacturing exports were USD 540 thousand (97% of the total).
For this period, the main departments that exported to this destination were: Bolívar (33%), Antioquia (20%), Valle Del Cauca (13%), Cauca (11%) and Risaralda (9%).
Imports
There are no imports registered in 2019.
There are no imports as of October 2020.
Investment
According to figures from the Banco de la República, there are no FDI flows with Saint Vincent and the Grenadines.
Tourism
In 2019, 69 tourists from Saint Vincent and the Grenadines entered Colombia (34% less than what was registered in 2018 when 105 entered) Likewise, 15 Colombians chose the island of Saint Vincent and the Grenadines as a tourist destination (15% more than in 2018 when 13 Colombians came out).
* Sources: Figures taken from the Observatory-OEE. Exports 12/04/2020 - Imports 12/23/2020 Prepared by the Ministry of Commerce, Industry and Tourism.
Surinam
Balanza Comercial
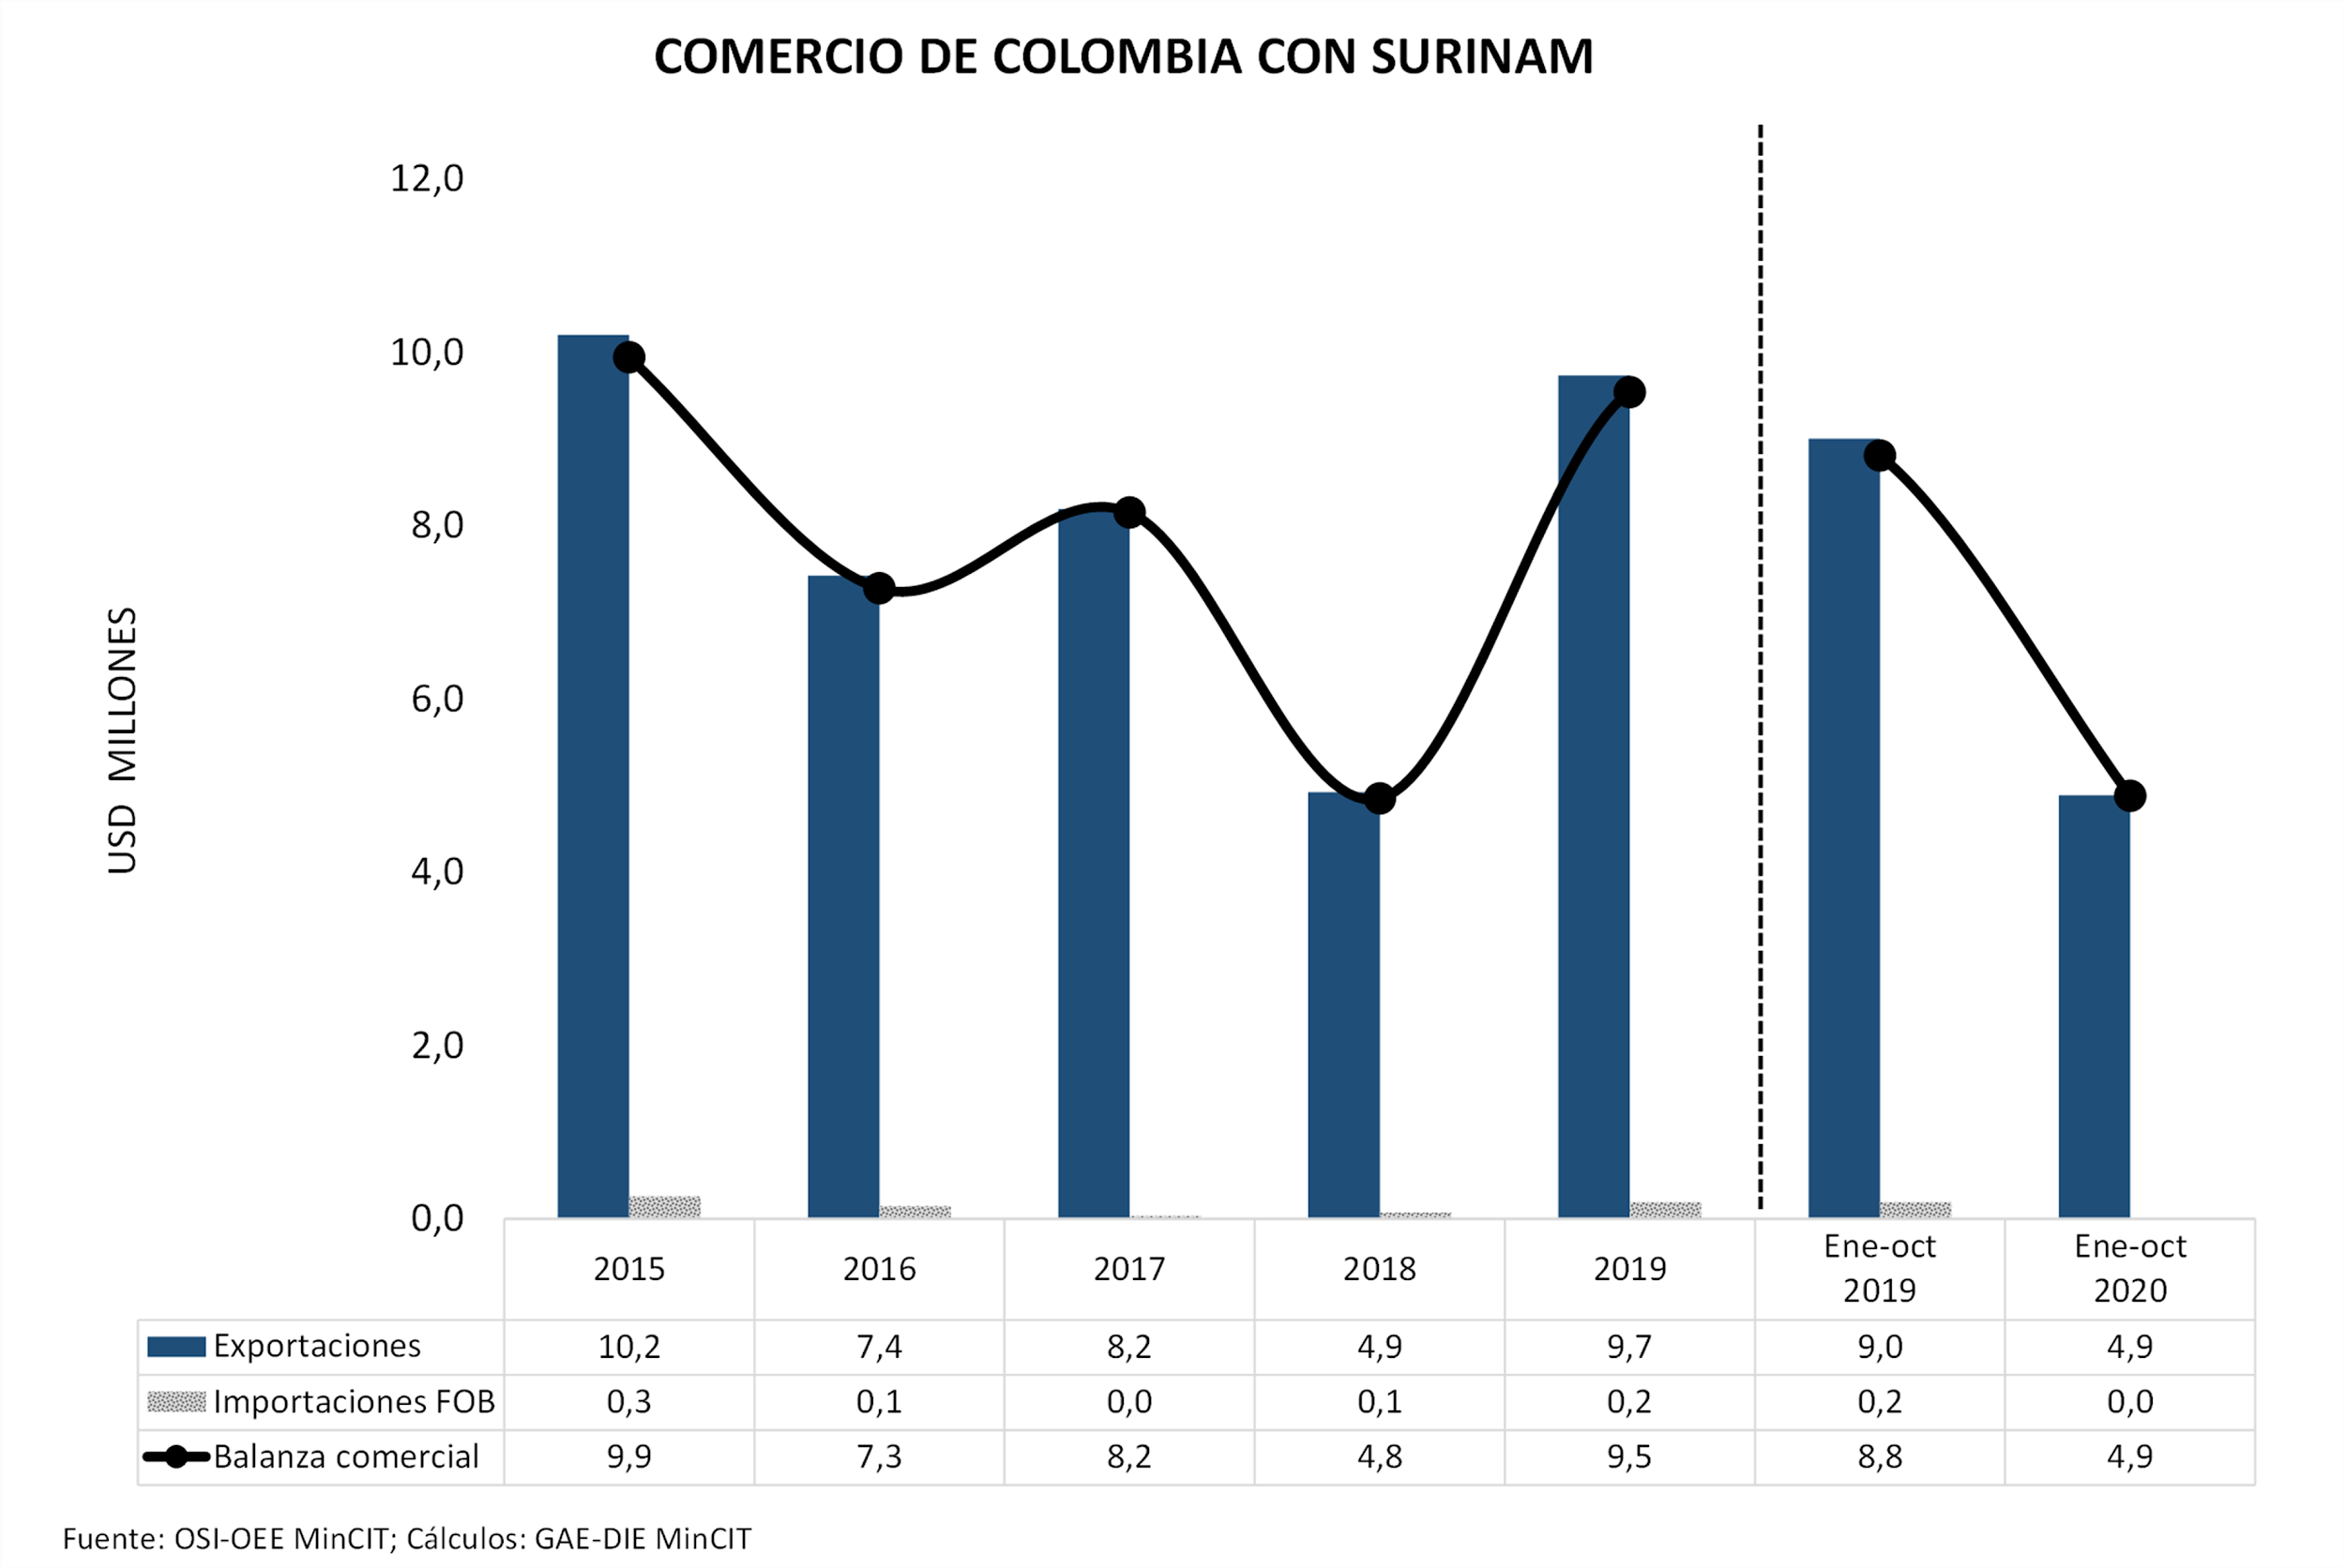
Tradicionalmente la balanza comercial con Surinam es superavitaria para Colombia. En 2019, por USD 9,5 millones (la agrícola en USD 2,5 millones y la industrial en USD 7 millones), con exportaciones por USD 9,7 millones (98% más que 2018) e importaciones por USD 0,2 millones (162% más que 2018).
A octubre de 2020, la balanza comercial fue superavitaria para Colombia en USD 4,9 millones (la agrícola en USD 2,6 millones y la industrial en USD 2,3 millones). Las exportaciones fueron de USD 4,9 millones (46% menos que el año anterior) y las importaciones fueron de USD 0,007 millones (96% menos que el mismo periodo del año anterior).
En 2019, el 0,02% de las exportaciones totales de Colombia se dirigió hacia Surinam (destino 83), y este mercado a su vez originó el 0,0004% de las importaciones totales de Colombia (origen 145).
Exportaciones
En 2019, el 98% de los productos exportados fueron NME, destacando: paneles y consolas para control (33%), productos de panadería (17%), transformadores eléctricos (13%), pañales, compresas y tampones (7%) y artículos de confitería (4%).
Las exportaciones agrícolas fueron USD 3 millones (26% del total) y las industriales fueron USD 7 millones (74% del total). Las manufacturas fueron USD 10 millones (98% del total de exportaciones).
Los principales departamentos que exportaron a este destino fueron: Cundinamarca (35%), Antioquia (34%), Valle Del Cauca (9%), Risaralda (9%) y Bogotá (6%).
A octubre 2020, los principales productos exportados a este destino fueron: productos de panadería, pastelería o galletería (25%), azúcar de caña o remolacha (15%), pañales para bebés, compresas y tampones (11%), tubos y perfiles huecos, de hierro o acero (6%) y partes para niveladoras, tornos y gatos (6%).
Las exportaciones agrícolas fueron de USD 2,5 millones (51% del total) y las industriales de USD 2,4 millones (49% del total).
Durante este periodo, el 99% de las exportaciones fueron NME (USD 4,8 millones) y las exportaciones de manufacturas fueron de USD 4,7 millones (96% del total).
Para este periodo los principales departamentos que exportaron a este destino fueron: Antioquia (61%), Valle Del Cauca (24%), Caldas (3%), Bogotá (3%) y Risaralda (3%).
Importaciones
En 2019, el 100% de los productos importados fueron industriales, destacándose: diodos, transistores y semiconductores de luz (86%), cigüeñales y engranajes (7%), centrifugadoras (4%), contadores de gas (1%) y bombas para líquidos (1%).
Los principales departamentos de compra fueron: Bogotá (98%), Valle Del Cauca (1%) y Santander (1%).
A octubre 2020, los principales productos importados fueron: papel o cartón para reciclar (55%), salvados y moyuelos (21%), manufacturas de hierro o acero (9%), manufacturas de caucho vulcanizado sin endurecer (6%) y caucho endurecido (4%).
Las importaciones agrícolas fueron de USD 0,001 millones (21% del total) y las industriales de USD 0,006 mil (79% del total).
Para este periodo, los principales departamentos de importación fueron: Valle Del Cauca (55%), Santander (21%), Bogotá (15%) y Cundinamarca (9%).
Inversión
Según cifras del Banco de la República, la Inversión Extranjera Directa (IED) de Colombia en Surinam durante el 2019 fue de USD 1 mil, para un acumulado de USD 3 millones desde 1994. No se registran flujos de IED de Surinam hacia Colombia.
Turismo
En el 2019, se registró un ingreso de 688 turistas de Surinam en Colombia (14% más que lo registrado en 2018 cuando ingresaron 604) Así mismo, 505 colombianos visitaron Surinam (151% más que en 2018, cuando salieron 201 colombianos).
A octubre de 2020, se registró un ingreso de 135 turistas de Surinam en Colombia; a su vez, 294 viajeros colombianos eligieron Surinam como destino turístico.
*Fuentes: Cifras tomadas del Observatorio-OEE. Exportaciones 04/12/2020 - Importaciones 23/12/2020 Elaboró Ministerio de Comercio, Industria y Turismo.
Trade Balance
Traditionally, the trade balance with Suriname is a surplus for Colombia. In 2019, for USD 9.5 million (agriculture in USD 2.5 million and industrial in USD 7 million), with exports for USD 9.7 million (98% more than 2018) and imports for USD 0.2 million (162% more than 2018).
As of October 2020, the trade balance was in surplus for Colombia by USD 4.9 million (agricultural by USD 2.6 million and industrial by USD 2.3 million). Exports were USD 4.9 million (46% less than the previous year) and imports were USD 0.007 million (96% less than the same period of the previous year).
In 2019, 0.02% of Colombia's total exports went to Suriname (destination 83), and this market in turn originated 0.0004% of Colombia's total imports (origin 145).
Exports
In 2019, 98% of the exported products were NME, highlighting: panels and consoles for control (33%), bakery products (17%), electrical transformers (13%), diapers, pads and tampons (7%) and confectionery articles (4%).
Agricultural exports were USD 3 million (26% of the total) and industrial exports were USD 7 million (74% of the total). Manufactures were USD 10 million (98% of total exports).
The main departments that exported to this destination were: Cundinamarca (35%), Antioquia (34%), Valle Del Cauca (9%), Risaralda (9%) and Bogotá (6%).
As of October 2020, the main products exported to this destination were: bakery, pastry or cookie products (25%), cane or beet sugar (15%), baby diapers, pads and tampons (11%), tubes and profiles holes, of iron or steel (6%) and parts for graders, lathes and jacks (6%).
Agricultural exports were USD 2.5 million (51% of the total) and industrial exports were USD 2.4 million (49% of the total).
During this period, 99% of exports were NME (USD 4.8 million) and manufacturing exports were USD 4.7 million (96% of the total).
For this period, the main departments that exported to this destination were: Antioquia (61%), Valle Del Cauca (24%), Caldas (3%), Bogotá (3%) and Risaralda (3%).
Imports
In 2019, 100% of imported products were industrial, standing out: diodes, transistors and light semiconductors (86%), crankshafts and gears (7%), centrifuges (4%), gas meters (1%) and pumps for liquids (1%).
The main purchasing departments were: Bogotá (98%), Valle Del Cauca (1%) and Santander (1%).
As of October 2020, the main imported products were: paper or cardboard for recycling (55%), bran and sharps (21%), iron or steel articles (9%), unhardened vulcanized rubber (6%) and rubber hardened (4%).
Agricultural imports were USD 0.001 million (21% of the total) and industrial imports were USD 0.006 thousand (79% of the total).
For this period, the main import departments were: Valle Del Cauca (55%), Santander (21%), Bogotá (15%) and Cundinamarca (9%).
Investment
According to figures from the Banco de la República, Colombia's Foreign Direct Investment (FDI) in Suriname during 2019 was USD 1.000, for an accumulated USD 3 million since 1994. There are no FDI flows from Suriname to Colombia.
Tourism
In 2019, 688 tourists from Suriname entered Colombia (14% more than that registered in 2018 when 604 entered). Likewise, 505 Colombians visited Suriname (151% more than in 2018, when 201 Colombians left).
As of October 2020, there was an entry of 135 tourists from Suriname in Colombia; in turn, 294 Colombian travelers chose Suriname as a tourist destination.
* Sources: Figures taken from the Observatory-OEE. Exports 12/04/2020 - Imports 12/23/2020 Prepared by the Ministry of Commerce, Industry and Tourism.